TANK MOUNTAINS
WESTERN ARIZONA
![]()
This is source is the farthest western source in Arizona. The source is located on the Yuma Proving Grounds in the central Tank Mountains UTM Zone 11 809360m Easting by 3673520m Northing, Department of Defense Palomas Mountain Quad 1:50,000 scale, north central Yuma County. The first samples were recovered by John R. Cook during a helicopter archaeological reconnaissance of the proving grounds in 1988. The nodules were within the Quaternary alluvium and embedded within a silicic ash flow. The five nodules analyzed are all less than three centimeters in diameter, but appear to be excellent media for tool production (since this time an additional ten samples have been analyzed some 5 cm in diameter; see Shackley 1991).
The source area was recorded by Rogers as A-111 (SDMOM) as a San Dieguito (Paleoindian) through Amargosa (Archaic) period site (1966:177). Rogers notes that the environment would be sufficient for late period occupation, but he recorded no late material, nor the obsidian nodules. Cook recovered a late period triangular concave based point produced from the Tank Mountain material at White Tanks. A photograph of the tanks in Rogers (1966:70) shows the ash flow tuff environment. The tanks have been eroded into the tuff sediments. Presumably the material has eroded into the local washes, but recent archaeological survey in the area has failed to locate any geological obsidian in surrounding alluvium (Jerome Schaefer: personal communication 1989). The source was published in Kiva (Shackley 1991).
Elemental concentrations for Tank Mountain source standards. All measurements in parts per million (ppm).
| SAMPLE | Ti | Mn | Fe | Rb | Sr | Y | Zr | Nb | Ba |
| WT1 | 608 | 389 | 10256 | 160 | 147 | 28 | 122 | 24 | 946 |
| WT2 | 564 | 387 | 10256 | 159 | 145 | 27 | 126 | 19 | 938 |
| WT3 | 560 | 439 | 10643 | 167 | 147 | 23 | 124 | 15 | 866 |
| WT4 | 1250 | 435 | 10994 | 172 | 157 | 21 | 118 | 22 | 712 |
| WT5 | 735 | 418 | 10302 | 160 | 142 | 22 | 121 | 17 | 870 |
| WT6 | 647 | 475 | 11117 | 167 | 149 | 26 | 126 | 22 | 813 |
| WT7 | 582 | 473 | 11372 | 178 | 157 | 26 | 129 | 22 | 1028 |
| WT8 | 785 | 512 | 11915 | 181 | 160 | 25 | 129 | 19 | 937 |
| WT9 | 639 | 442 | 10687 | 159 | 148 | 24 | 123 | 20 | 946 |
| WT10 | 563 | 410 | 10490 | 163 | 149 | 25 | 119 | 20 | 930 |
| WT12 | 549 | 403 | 10588 | 161 | 145 | 24 | 124 | 18 | 934 |
| LOC 3 | 661 | 407 | 10835 | 165 | 147 | 23 | 124 | 18 | 930 |
| LOC 2-1 | 668 | 448 | 11046 | 170 | 151 | 24 | 127 | 20 | 802 |
| LOC 2-2 | 618 | 428 | 10520 | 168 | 149 | 25 | 130 | 21 | 905 |
| WT11 | 527 | 382 | 10328 | 152 | 142 | 24 | 120 | 26 | 760 |
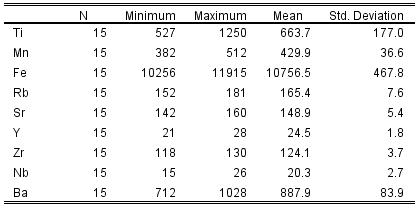
Mean and central tendency for the data in the table above
![]()
This page maintained by Steve Shackley (shackley@berkeley.edu).
Copyright © 2018 M. Steven Shackley. All rights reserved.
Revised: 10 November 2020
![]() Back to
the SW obsidian source page.
Back to
the SW obsidian source page.
![]()